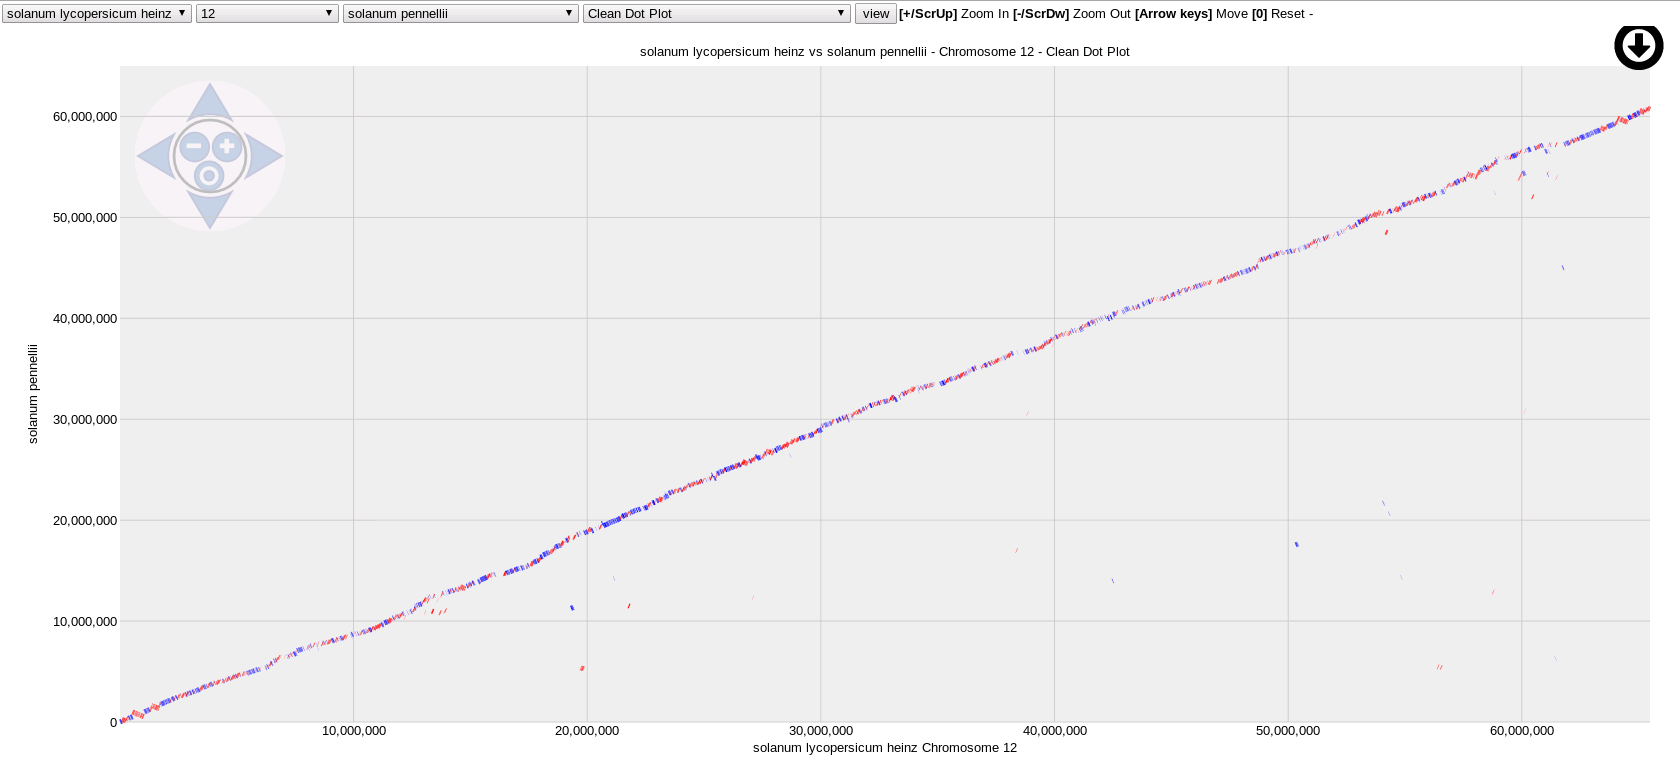
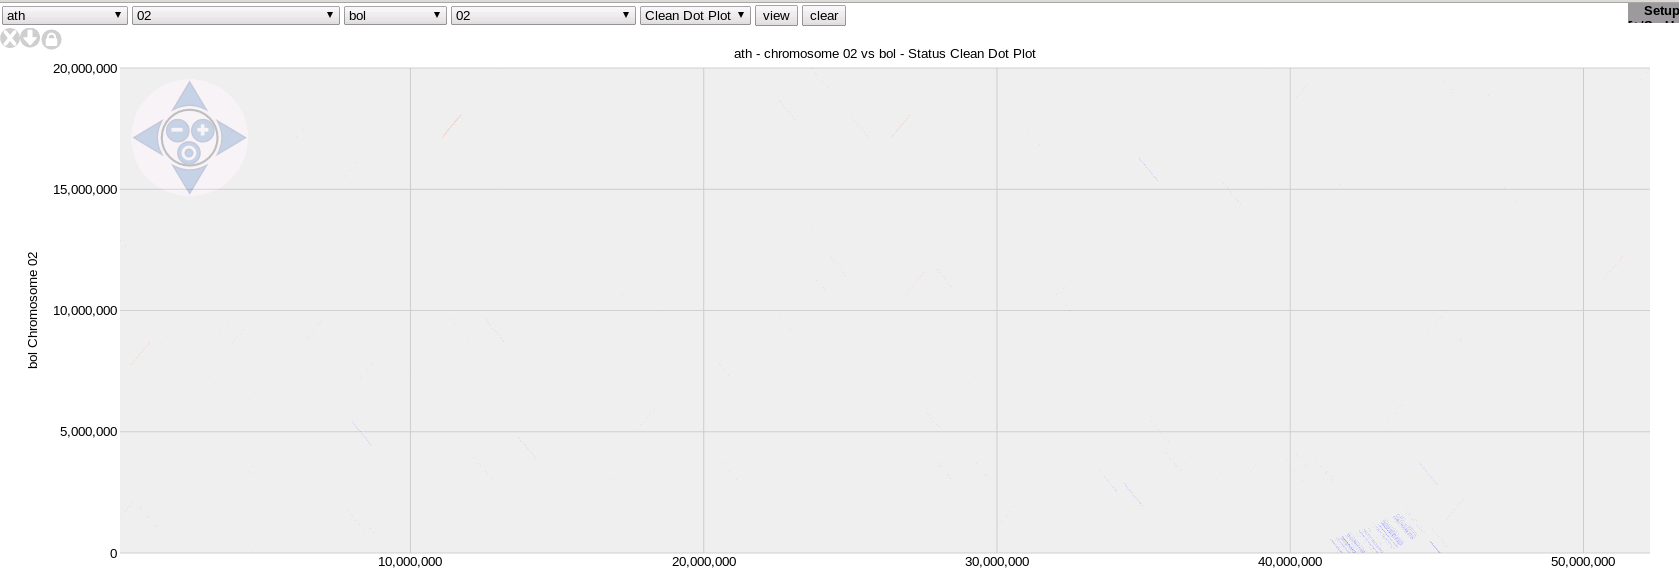
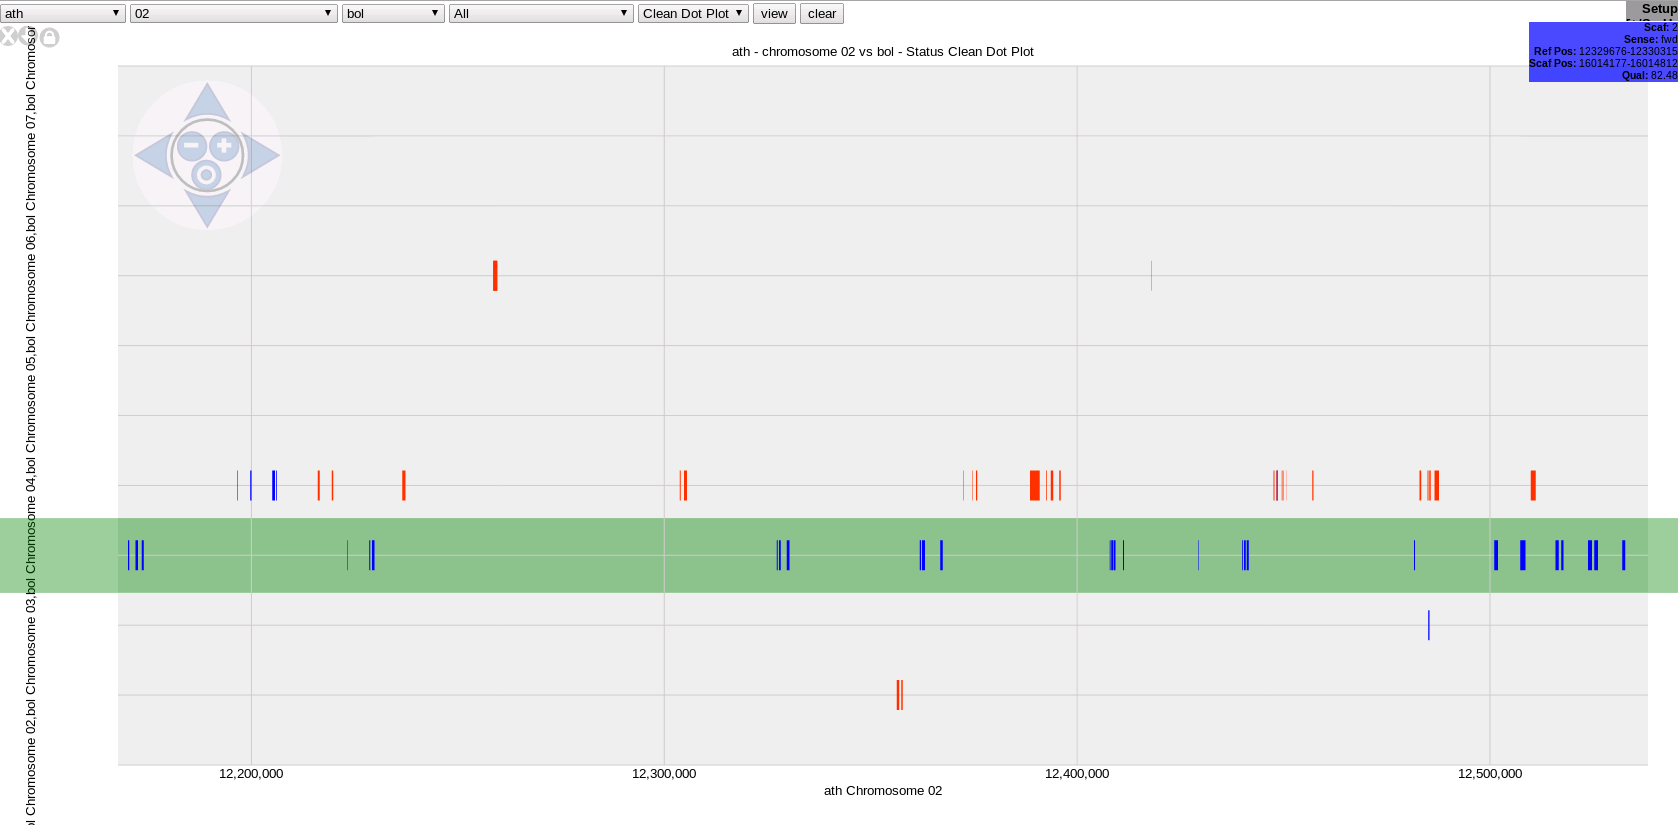
Given a set of .delta files, delta2js.py will convert those to javascript (under data/ folder) and create a list.js file.
By opening index.html in a browser (not Internet Explorer), choose reference, chromosome, target species and status.
The dot plot will be shown and can be browsed with either the keyboard or mouse.
Use arrow keys, +/-/0, drag with mouse, [shift] double-click, scroll-wheel or use the compass.
On the top left corther of each graph there's a button to save the current view to a svg file.
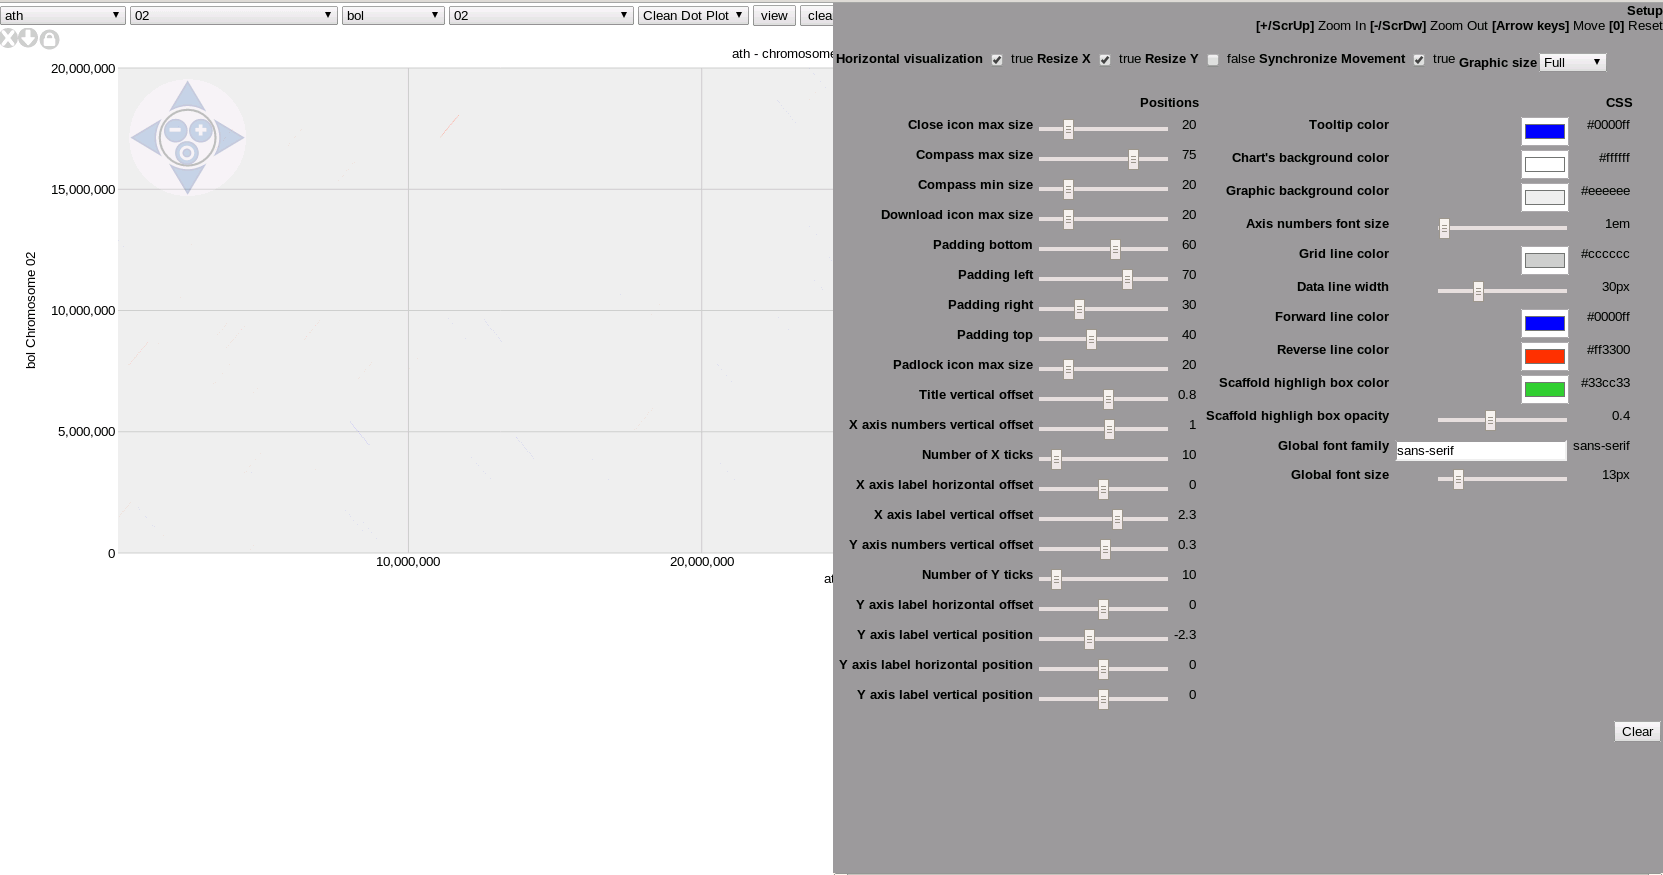
On the top right corther there's a help message. Hover over it to all configurations and help available.
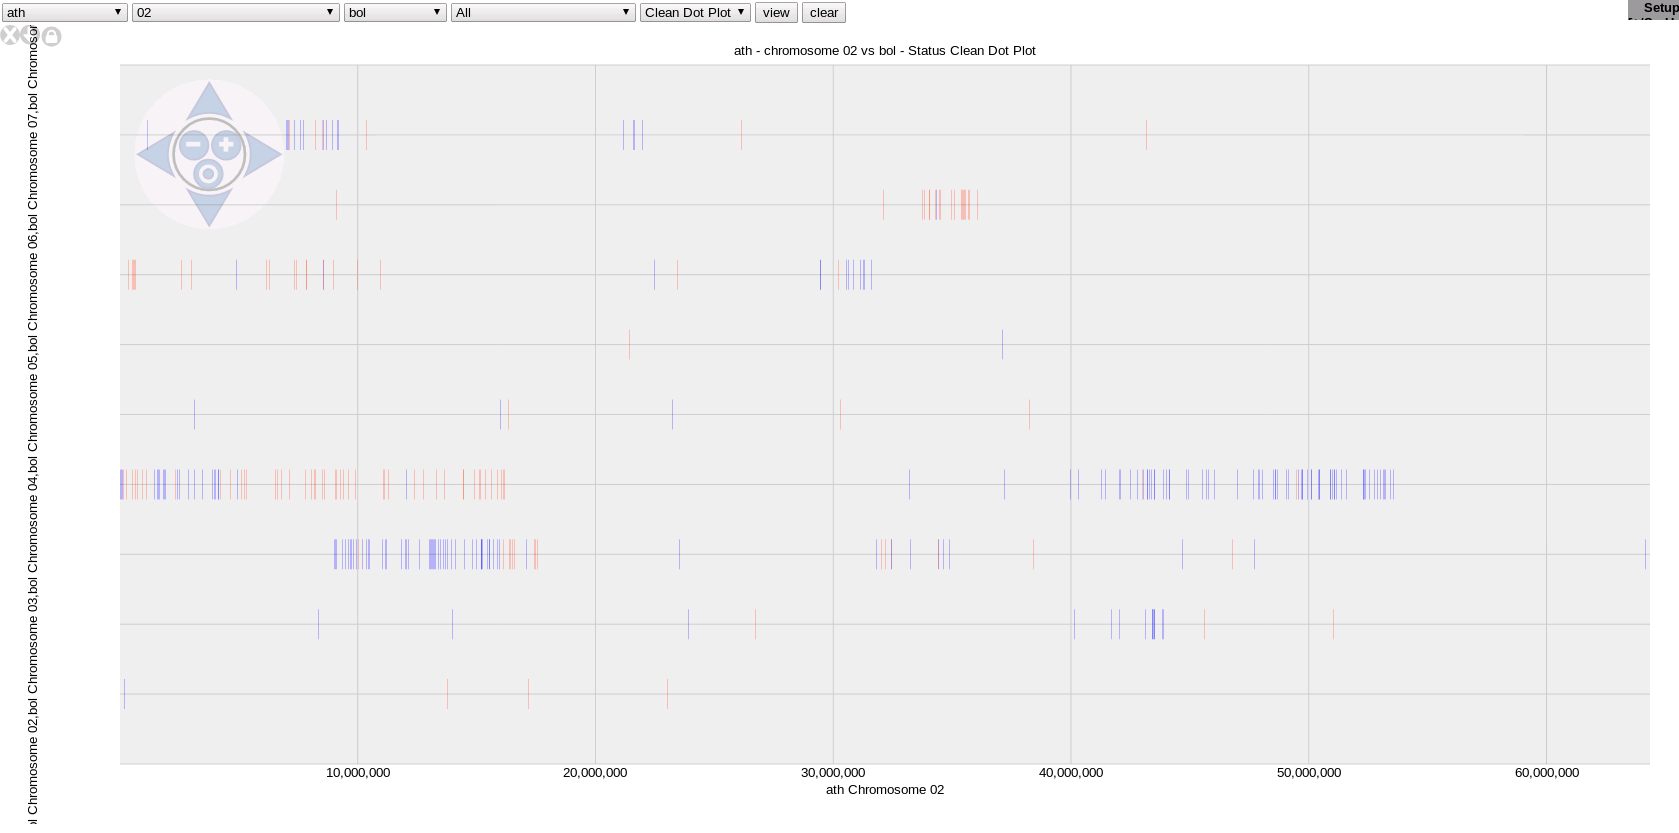
### A diagonal plot for distant species ### Configuration pop-up ### Horizontal multi display ### Horizontal multi display - Zoomed with description in the right corner ### SVG output ### SVG output - zoomed- Mummer - http://mummer.sourceforge.net/
- D3 - http://d3js.org/
- JQuery - http://jquery.com/
- Tipsy - http://onehackoranother.com/projects/jquery/tipsy/
- Stepheneb - http://bl.ocks.org/stepheneb/1182434
- SVG Crowbar - http://nytimes.github.io/svg-crowbar/
- SMO script - http://www.shawnolson.net
- ParseUri - http://blog.stevenlevithan.com/archives/parseuri
- Nijiko Yonskai - https://gist.github.com/Nijikokun/5192472
Agnostic of the project, gets all data from list.js, creates the drop-down lists and plots when requested.
Workhorse of the graphics library.
Contains the scaffold of the page.
Converts .delta files to cartesian coordinates.
delta2js.py MUST be modified to your own project file naming.
It exports all values to java script files because that's the only type of file that can be loaded in a browser without a web server.
It exports a list (data/list.js) and several databases (data/*.js);
data/list.js contains all the available files and their sources (reference, chromosome, target and status), the x/y axis labels and the graphic title. This file will be loaded automatically and will draw the options drop-down list.
data/*.js contains minimum and maximum values, as well as an array with all coordinates.
cd data
rm ../../../out/*.js
../delta2js.py ../../../out/*.delta
cp -l ../../../out/*.js .
rm webmummer.tar.xz; tar --exclude .git -ahcvf webmummer.tar.xz .var _db_version = "2013_11_27_14_25_43";
var _refsNames = ['ath', 'bol'];
var _refsChroms = ['01', '02', '03', '04', '05', '06', '07', '08', '09'];
var _tgtsNames = ['ath', 'bol', 'bra'];
var _tgtsChroms = ['01', '02', '03', '04', '05', '06', '07', '08', '09', '10'];
var _statuses = ['Clean Dot Plot', 'Raw Dot Plot'];
var _filelist = {
'ath': {
'01': {
'ath': {
'01': {
'Clean Dot Plot': {
'filename': 'ath1_ath1.delta.filter.js'
},
'Raw Dot Plot': {
'filename': 'ath1_ath1.delta.js'
}
}
}
}
}
};_filelist[ 'ath' ][ '01' ][ 'ath' ][ '01' ][ 'Clean Dot Plot' ][ 'title' ] = 'ath Chromosome 01 vs ath Chromosome 01 - Clean Dot Plot';
_filelist[ 'ath' ][ '01' ][ 'ath' ][ '01' ][ 'Clean Dot Plot' ][ 'xlabel' ] = 'ath Chromosome 01';
_filelist[ 'ath' ][ '01' ][ 'ath' ][ '01' ][ 'Clean Dot Plot' ][ 'ylabel' ] = 'ath Chromosome 01';
_filelist[ 'ath' ][ '01' ][ 'ath' ][ '01' ][ 'Clean Dot Plot' ][ 'points' ] = [1,2,13201252,13201253,0,0,100.00];
_filelist[ 'ath' ][ '01' ][ 'ath' ][ '01' ][ 'Clean Dot Plot' ][ 'xmin' ] = 1;
_filelist[ 'ath' ][ '01' ][ 'ath' ][ '01' ][ 'Clean Dot Plot' ][ 'xmax' ] = 30427671;
_filelist[ 'ath' ][ '01' ][ 'ath' ][ '01' ][ 'Clean Dot Plot' ][ 'ymin' ] = 2;
_filelist[ 'ath' ][ '01' ][ 'ath' ][ '01' ][ 'Clean Dot Plot' ][ 'ymax' ] = 30427672;
_filelist[ 'ath' ][ '01' ][ 'ath' ][ '01' ][ 'Clean Dot Plot' ][ 'tgts' ] = ['1'];- permit multiple selection
- calculate maxX and maxY
- add zoom and position to address bar
- separate session preferences from global preferences
- allow parallel display
- apply sizes configuration
- allow for multiple plots
- highlight same scaffold
- clean out-of-graph lines
- better keyboard zoom
- sync resize axis
- replace all jquery selector for d3 selector in simple-graph.js
- disable auto load
use jquery-ui to drop-down lists
allow enablig circles
git checkout --orphan gh-pages
rm -rf css/ data/ js/ delta2js.* index.html LICENSE.md
rm .gitignore
echo "My GitHub Page" > index.html
git add index.html
git add solanum-lycopersicum-heinz-vs-solanum-pennellii---Chromosome-12---Clean-*
git commit -am 'my first page'
push origin gh-pages
git checkout master