2.0.0
Plotly.NET 2.0
Plotly.NET finally has reached all milestones for 2.0 and is ready for a stable release.
This release is the culmination of almost 2 years of work in >500 commits by 17 contributors.
Here is an attempt to visualize the history of these changes in a few seconds:

(made with gource)
All APIs have changed significantly - this release is incompatible with 1.x and many 2.x-preview/beta versions.
TL;DR
- All plotly chart/trace types!
- Unified API!
- chart rendering in notebooks!
- programmatic static image export!
- Exhaustive docs!
- We have a discord server, feel free to ask questions there!
Core library
General
- The API layer model has refined and used for every type of plotly object abstraction. In brief,
- There are 5 main categories of abstractions:
Trace(chart data and type),Layout(non-data chart styling),Config(render options),DisplayOptions(html display options),StyleParam(DSL for styling options) - Many properties used in these levels are themselves objects, which are in the respective
*Objectsnamespace (e.g.Geo, which determines map layout of geo traces is an object on theLayoutand therefore in theLaoutObjectsnamespace.) - every object is based on
DynamicObjand its properties can therefore be further customised by dynamic member assignment. Therefore, every plotly property can be set manually, even those which do not have direct abstractions.
- There are 5 main categories of abstractions:
- There are now several
Tracetypes for each kind of subplot (Trace2D,Trace3D, etc.) and eqivalentCharttypes (Chart2D,Chart3D, etc). while not visible from the top level api (everything kan be accessed via the unifiedChartAPI), this greatly improves correct multi chart layouting. - There are 3 ways of creating charts with increasing level of customization:
- The
ChartAPI as a unified API surface for chart creation and stylingChart.<ChartType>(e.g.Chart.Point) for chart creation from data and some chart specific styling optionsChart.with<Style or object>(e.g.Chart.withXAxisStyle) for styling of chart objects
- Creation of Chart objects by manually creating
Trace,LayoutandConfigobjects with many more optional customization parameters - Exclusive usage of
DynamicObj- you can translate any plotly.js javascript with this method.
- The
Chart/Trace abstractions
You can create the following Charts with Plotly.NET's API (and many more by combining them):
-
Cartesian 2D (
Chart2D):Scatter(Point, Line, Spline, Bubble, Range, Area, SplineArea, StackedArea)FunnelWaterfallBar(Bar, Column, StackedBar, StackedColumn)HistogramHistogram2DHistogram2DContourPointDensityBoxPlotViolinHeatmap(Heatmap, AnnotatedHeatmap)ImageContourOHLC(OHLC, CandleSticks)Splom
-
Cartesian 3D (
Chart3D):Scatter3D(Point3D, Line3D, Bubble3D)SurfaceMesh3DConeStreamTubeVolumeIsoSurface
-
Polar (
ChartPolar):ScatterPolar(PointPolar, LinePolar, SplinePolar, BubblePolar)BarPolar
-
Maps (
ChartMap):ChoroplethMapChoroplethMapboxScatterGeo(PointGeo, LineGeo, BubbleGeo)ScatterMapbox(PointMapbox, LineMapbox, BubbleMapbox)DensityMapbox
-
Ternary (
ChartTernary):ScatterTernary(PointTernary, LineTernary, SplineTernary, BubbleTernary)
-
Carpet (
ChartCarpet):CarpetScatterCarpet(PointCarpet, LineCarpet, SplineCarpet, BubbleCarpet)ContourCarpet
-
Domain (
ChartDomain)Pie(Pie, Doughnut)FunnelAreaSunburstTreemapParallelCoordParallelCategoriesSankeyTableIndicatorIcicle
-
Smith (
ChartSmith)ScatterSmith(PointSmith, LineSmith, BubbleSmith)
Plotly.NET.Interactive
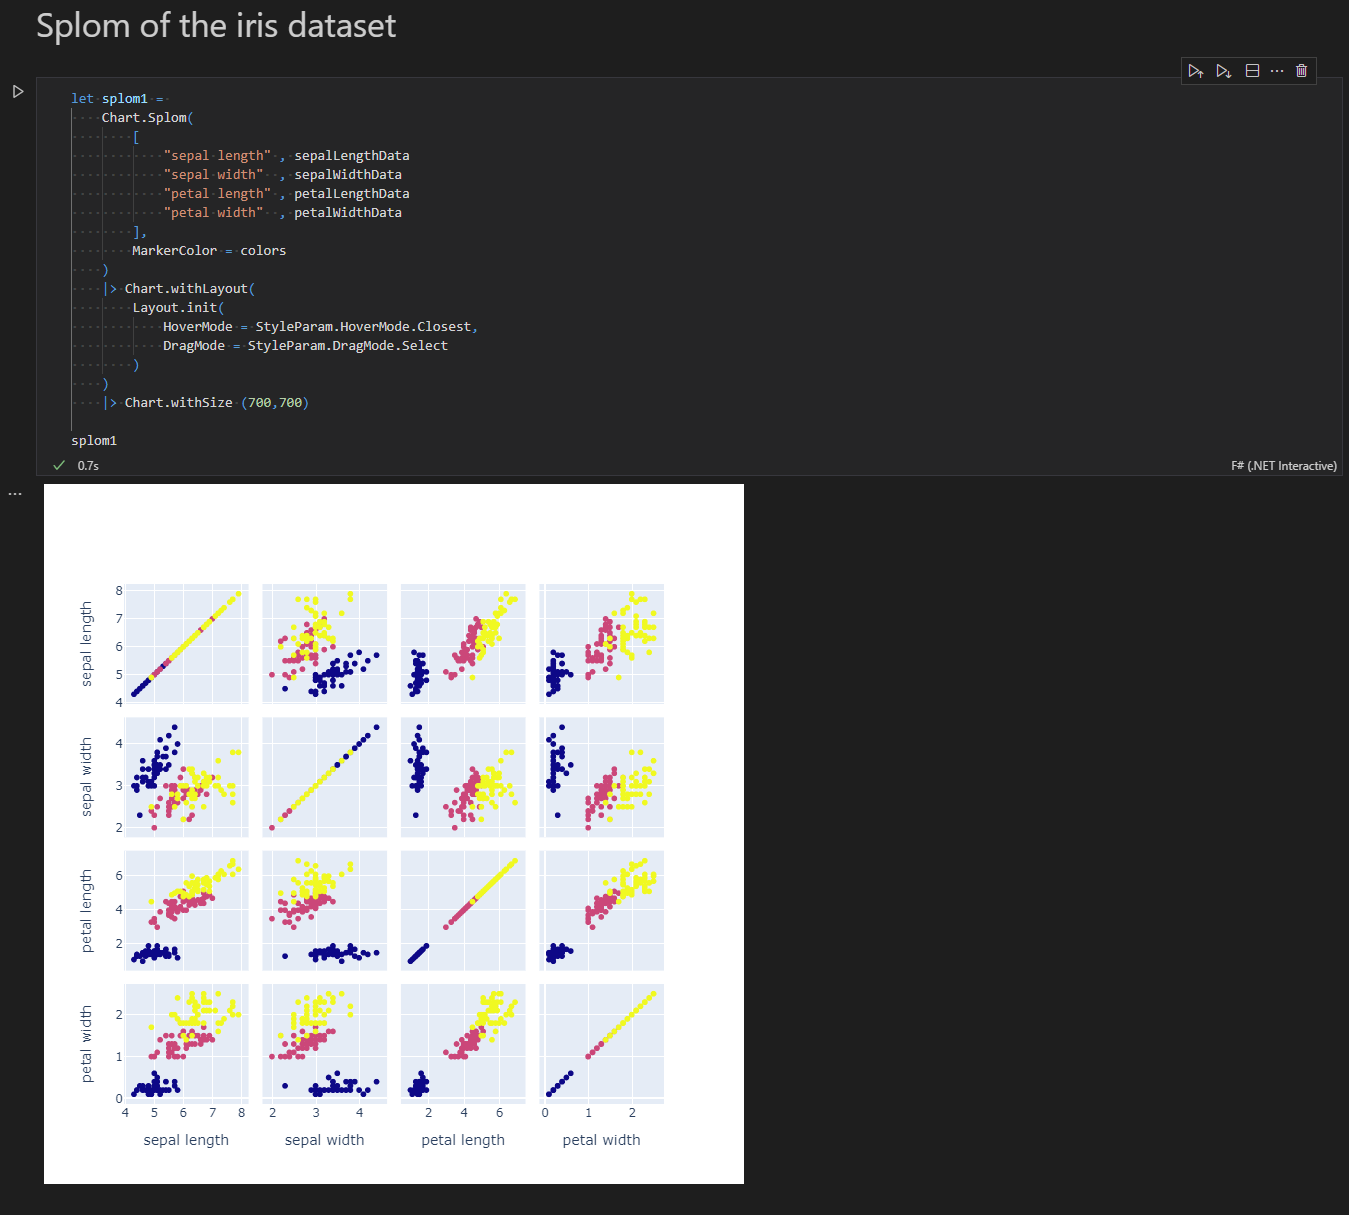
You can directly render charts as html cell output with the dotnet interactive kernel:
Plotly.NET.ImageExport
This library provides an interface for image rendering engines to consume plots and create static image files (PNG, JPG, SVG), as well as a reference implementation using PuppeteerSharp to render charts with headless chromium.